Staff, members and partners of the Greater Raritan Workforce Development Board (GRWDB) are constantly collecting data to understand the impact of services and programs upon the stakeholders being helped.
GRWDB Performance Dashboard
The interactive GRWDB Performance Dashboard provides information on applicants that use the Local Area’s various services. The data used to build this presentation is pulled from a detailed Excel dashboard report compiled monthly by One-Stop Operator Fernandel Almonor using service-level numbers provided by all Greater Raritan Local Area partners. This includes services offered by the GRWDB, vendor partners for career training, youth and WorkFirst New Jersey, and state partners from Employment Services and the Division of Vocational Rehabilitation Services.
As you go through each page, you can see more details by hovering or clicking on any chart in the report. (Here’s a usage tip: when you click on the number of the bottom of the report, the title of every slide appears, so it’s easier to find what you are looking for.) This dashboard evolves over the course of our program year (July 1st to June 30th) and exploration is encouraged. The local Excel Dashboard is reviewed regularly by GRWDB board members and partners and is available for review. If you have questions, suggestions or would like a copy of the local Excel dashboard, email info@thegrwdb.org.
GRWDB WIOA Dashboard
The New Jersey Department of Labor maintains separate dashboards focusing on Workforce Innovation and Opportunity Act (WIOA) performance metrics for each of New Jersey’s Local Workforce Development Boards. These dashboards allow users to explore WIOA program quarterly outcomes since 2019 for Title I Adult, Dislocated Worker and Youth participants as well as Title III Wagner-Peyser (Employment Services) customers.
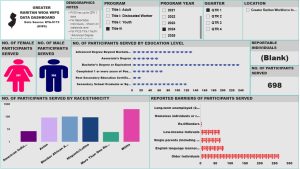 To explore the NJDOL’s Greater Raritan WIOA Dashboard, go here. The first page of the dashboard, shown at left, details participants characteristics – sex, education levels, race/ethnicity; and any barriers to employment. The second page provides the rate of attainment for employment after exiting the WIOA program, credential attainment rate, and the rate of measurable skills gains. The third page details the numbers of individuals receiving services and the employment, median earnings and credential rate by quarter. The fourth dashboard page shows the percentage of employment after exiting the program as well as median income, credential and measurable skill gain rates compared to the goals set for each program by the state for the local board. This data translates into real impact. For example, when the GRWDB median earning target is exceeded, that means that participants are getting paychecks well above plan.
In addition, the U.S. Department of Labor launched a performance dashboard August 14, 2025, that provides with information on the effectiveness of federal -funded WIOA programs nationwide. The dashboard includes Program Year 2023 data (July 1, 2023, to June 30, 2024) from more than 550 local workforce development boards nationwide, giving a granular view of WIOA program performance. New Jersey’s information can be found on Page 8 of the dashboard. Data from Program Year 2024 (July 1, 2024, to June 30, 2025) has not yet been uploaded.
2021 Somerset County Board of County Commissioners
Shanel Y. Robinson, Director
Melonie Marano, Deputy Director
Paul Drake, Commissioner
Douglas Singleterry, Commissioner
Sara Sooy, Commissioner
2021 Hunterdon County Board of County Commissioners
John E. Lanza, Director
Zachary T. Rich, Deputy Director
J. Matthew Holt, Commissioner
Susan Soloway, Commissioner
Shaun C. Van Doren, Commissioner